I added an interval function to my ‘propagate’ package (now on CRAN) that conducts error propagation based on interval arithmetics. It calculates the uncertainty of a model by using interval arithmetics based on (what I call) a “combinatorial sequence grid evaluation” approach, thereby avoiding the classical dependency problem that often inflates the result interval.
This is how it works:
For two variables 
![[x_1, x_2]](https://s0.wp.com/latex.php?latex=%5Bx_1%2C+x_2%5D&bg=ffffff&fg=333333&s=0&c=20201002)
![[y_1, y_2]](https://s0.wp.com/latex.php?latex=%5By_1%2C+y_2%5D&bg=ffffff&fg=333333&s=0&c=20201002)
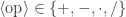
![[x_1, x_2] \,\langle\!\mathrm{op}\!\rangle\, [y_1, y_2] =](https://s0.wp.com/latex.php?latex=%5Bx_1%2C+x_2%5D+%5C%2C%5Clangle%5C%21%5Cmathrm%7Bop%7D%5C%21%5Crangle%5C%2C+%5By_1%2C+y_2%5D+%3D&bg=ffffff&fg=333333&s=0&c=20201002)

![\left. \max(x_1 \langle\!\mathrm{op}\!\rangle y_1, x_1 \langle\!\mathrm{op}\!\rangle y_2, x_2 \langle\!\mathrm{op}\!\rangle y_1, x_2 \langle\!\mathrm{op}\!\rangle y_2)\right]](https://s0.wp.com/latex.php?latex=%5Cleft.+%5Cmax%28x_1+%5Clangle%5C%21%5Cmathrm%7Bop%7D%5C%21%5Crangle+y_1%2C+x_1+%5Clangle%5C%21%5Cmathrm%7Bop%7D%5C%21%5Crangle+y_2%2C+x_2+%5Clangle%5C%21%5Cmathrm%7Bop%7D%5C%21%5Crangle+y_1%2C+x_2+%5Clangle%5C%21%5Cmathrm%7Bop%7D%5C%21%5Crangle+y_2%29%5Cright%5D&bg=ffffff&fg=333333&s=0&c=20201002)
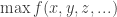
So for a function ![f([x_1, x_2], [y_1, y_2], [z_1, z_2], ...)](https://s0.wp.com/latex.php?latex=f%28%5Bx_1%2C+x_2%5D%2C+%5By_1%2C+y_2%5D%2C+%5Bz_1%2C+z_2%5D%2C+...%29&bg=ffffff&fg=333333&s=0&c=20201002)


![R = [\min R_i, \max R_i]](https://s0.wp.com/latex.php?latex=R+%3D+%5B%5Cmin+R_i%2C+%5Cmax+R_i%5D+&bg=ffffff&fg=333333&s=0&c=20201002)
The so-called dependency problem is a major obstacle to the application of interval arithmetic and arises when the same variable exists in several terms of a complicated and often nonlinear function. In these cases, over-estimation can cover a range that is significantly larger, i.e. 

![[x_1, x_2]](https://s0.wp.com/latex.php?latex=%5Bx_1%2C+x_2%5D+&bg=ffffff&fg=333333&s=0&c=20201002)


If the interval is of type ![[x_1 < 0, x_2 > 0]](https://s0.wp.com/latex.php?latex=%5Bx_1+%3C+0%2C+x_2+%3E+0%5D+&bg=ffffff&fg=333333&s=0&c=20201002)
![[-1, 1]^2 = [-1, 1][-1, 1] = [-1, 1]](https://s0.wp.com/latex.php?latex=%5B-1%2C+1%5D%5E2+%3D+%5B-1%2C+1%5D%5B-1%2C+1%5D+%3D+%5B-1%2C+1%5D+&bg=ffffff&fg=333333&s=0&c=20201002)
![[0, 1]](https://s0.wp.com/latex.php?latex=%5B0%2C+1%5D+&bg=ffffff&fg=333333&s=0&c=20201002)
curve(x^2, -1, 1). Some examples to illustrate:
## Example 2: A complicated nonlinear model.

## Reduce sequence length to 2 => original interval

## for quicker evaluation.

EXPR2 <- expression(C * sqrt((520 * H * P)/(M *(t + 460))))

H <- c(64, 65)

M <- c(16, 16.2)

P <- c(361, 365)

t <- c(165, 170)

C <- c(38.4, 38.5)

DAT2 <- makeDat(EXPR2)

interval(DAT2, EXPR2, seq = 2)

[1317.494, 1352.277]
## Example 5: Overestimation from dependency problem.

# Original interval with seq = 2 => [1, 7]

EXPR5 <- expression(x^2 - x + 1)

x <- c(-2, 1)

DAT5 <- makeDat(EXPR5)

interval(DAT5, EXPR5, seq = 2)

[1, 7]
# Refine with large sequence => [0.75, 7]

interval(DAT5, EXPR5, seq = 100)

[0.7502296, 7]

# Tallies with curve function.

curve(x^2 - x + 1, -2, 1)
Have fun!
Cheers,
-ans
